Containerisation done right: reduce infrastructure TCO and product time to market. Part 2
Containers orchestration and scheduling
When you have multiple containers to run it makes sense to run them with some form of system which would take care of the container lifecycle. That is launching, terminating, restarting them, managing resources, scaling, etc. There are multiple technologies taking care that are worthy to mention such as Kubernetes, ECS, Nomad, Rancher and few more. I’m going to proceed with Kubernetes which I consider a good fit for many different types of workload and use cases. Of course, no one-solution-fits-all thus you need to make your own judgement and decide on orchestration and scheduling solution.
Kubernetes as a solution
Kubernetes is an excellent solution for running containers at scale. It’s quite mature at the time of writing, rapidly evolving and with a very big open-source community behind it. Actively maintained by the Cloud Native Computing Foundation and originally designed by Google engineers, it allows you to run both Docker and Rkt containers. It has multiple off the shelf add-ons which can expand capabilities of the platform without much effort. There are plenty of tools for creating Kubernetes clusters in Cloud platforms or on bare metal – and to name but a few: kops, kubeadm, kube-AWS, etc. If you are on Google Cloud Platform you may choose to use the ‘off the shelf’ Google Kubernetes Engine.
From a super high-level overview, Kubernetes has an odd number of masters with 3 being deemed reasonable for highly available clusters. Those masters run a series of services responsible for functions of the cluster. Kubernetes heavily relies on an ETCD cluster. Kubernetes ETCD cluster can be either external to masters or run on them. Kubernetes schedules to run containers on Nodes – worker instances. Their size and resources may vary and nodes can be added and removed to/from running cluster.
Running containers on Kubernetes
Let’s do a deep-dive into Kubernetes to get a rough idea how its components are organised and related. I will base the example on a single service containerised service which I want to run on Kubernetes and then expose to the Internet. We need to wrap our container into Kubernetes struct – which is called a Pod. Pod is the smallest building block of Kubernetes and usually runs a single container. For anything but a mere exercise you wouldn’t directly create a Pod but use other Kubernetes objects to create those – such as a Deployment, StatefulSet or a DaemonSet. A Deployment will declaratively describe desired state of Pods and ReplicaSets. Deployments are quite flexible – they can be scaled, rolled back, updated – giving quite decent control over a state of an application. This leaves us with having the app running being covered.
We then need to define a way this service can be reliably accessed within the Kubernetes cluster and outside. This is achievable with Kuberentes abstraction called Service. Service simply defines a logical set of Pods and how those can be accessed. If you are more familiar with classical infrastructure setups you can think of Service as of Load Balancer and Pods as backend servers which can join the Load Balancer and drop from it at any time. We need Service as a point of entry into the the Pod/application. The last piece in this stack of Kubernetes objects is Ingress. Ingress allows external traffic to reach Services. Ingress is required because Pods and Services IPs are typically (depending on cluster network) routable only within a Kuberentes cluster. Thus Ingress is required for external traffic to reach Pods. Let’s visualise this with following diagram.
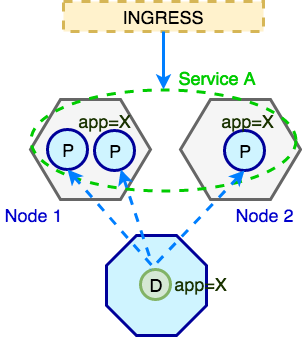
To recap briefly: all external (non-Kubernetes) traffic comes in through Ingress, Ingress routes it to the Service which then directs it to one of the Pods with matching labels (i.e. app=X). Those Pods are created by Deployment.
Essential components of an IT platform
The real power of good PaaS comes from supporting tools, technologies, and build in capabilities. Whether there is a low or high entry barrier for using them and whether you can automate configuration without hacking or re-engineering whole solution. Below is list of what I consider must-have essentials to be covered. Setting those up on Kubernetes is pretty straightforward and well documented. However, there are many approaches to achieve the same or similar results, so you need to decide what suits you best.
Monitoring and telemetry
It is crucial that monitoring and telemetry of infrastructure and services is done right from the start and that it scales with the platform. There are a multitude of tools available to collect, aggregate and visualise various metrics of cluster health, capacity, as well as those of running services. I am a big fan of Prometheus Operator by CoreOS. It basically creates a Prometheus instance and configures it dynamically. It also defines custom Kubernetes objects such as ServiceMonitor. It makes it easier to discover what to scrape within the Kubernetes cluster. If you need Prometheus to scrape some new metrics from a specific application running on Kubernetes just define a new ServiceMonitor and apply it to the cluster. I like to use Grafana for metrics visualisation. Again, as part of cluster deployment you can pre-define Grafana metrics and Datasources so that when a brand new cluster comes up, you will have your Gafana configured and loaded with favourite metrics. When it comes to collecting metrics of the cluster itself there are plenty of options as well, two examples are Node exporter and Kube State Metrics.
Alerting
Alerting – a sibling of monitoring. You want to know that something when something has gone wrong with your app or PaaS before people start shouting on Slack or Twitter! Again, you can programmatically define Prometheus Alerts. Define them, store in SCM, and apply new changes as they happen.
Log collection and discovery
Everything generates logs: applications, instances and Kubernetes internal services. It’s relatively easy to collect all the metrics. The challenge is to collect and label metrics at the same time so that those are discoverable without much effort. For Kubernetes my favourite stack is EFK – ElasticSearch, FluentD and Kibana – just like ELK but with FluentD. FluentD is quite amazing in picking up labels from Docker containers and decorating logs accordingly. Logs generated by Service ABC, running in specific namespace with some labels will be decorated and indexed accordingly – thus you will be able to search and discover relevant logs in Kibana accurately and fast.
Self-healing
This one needs to be done right – when a node forming a cluster (be it one of masters or a worker node) dies for whatever reason the cluster should cope with that. When setting Kubernetes clusters on AWS the use of ASG is quite obvious i.e. 3 ASGs for master nodes (in different AZ) and one or more ASGs for nodes where containers are scheduled. There are no problems with re-launching instances in this setup. Kubernetes has no problem with new nodes joining the cluster so new nodes can join cluster pretty seamlessly. At the same time Kubernetes can migrate/schedule Pods off unhealthy nodes into healthy ones.
Auto-scaling
With savings in mind, and where flexibility of platform autoscaling capabilities are must for any modern setup, we don’t want to pay for capacity we don’t need – until we need it. Kubernetes offers three types of autoscaling:
- Horizontal Pod Autoscaler – when certain scaling criteria are met, new pods are scheduled to provide additional capacity to given Deployment/ReplicaSet
- Vertical Pod Autoscaler – resources available to Pods (memory, CPU) are dynamically allocated as needed.
- Cluster Autoscaler – an autoscaler which modifies i.e. AWS ASG when existing nodes don’t have enough capacity to schedule requested Pods into the cluster
To be continued …
KUBERNETES
kubernetes Docker containerisation